
Logstash is an open-source data processing pipeline that ingests data from various sources, transforms it, and then sends it to a destination of your choice, typically Elasticsearch, for storage and analysis. Logstash is part of the Elastic Stack, along with Elasticsearch and Kibana, and is commonly used for log and event data collection and processing.
Capabilities of Logstash include:
• Data Ingestion: Logstash supports various input plugins to ingest data from different sources such as files, databases, message queues, and network protocols.
• Data Transformation: Logstash provides a wide range of filter plugins for transforming and enriching data. These filters can perform tasks like parsing, grokking, geoip lookup, anonymization, and more.
• Data Output: Logstash supports various output plugins to send processed data to different destinations such as Elasticsearch, Amazon S3, Kafka, and many others.
• Pipeline Processing: Logstash allows you to define complex data processing pipelines with multiple stages for ingestion, transformation, and output.
• Scalability: Logstash can be scaled horizontally to handle large volumes of data by distributing workload across multiple instances.
Logstash Service Architecture
Logstash processes logs from different servers and data sources and it behaves as the shipper. The shippers are used to collect the logs and these are installed in every input source. Brokers like Redis, Kafka or RabbitMQ are buffers to hold the data for indexers, there may be more than one broker as failed instances.
Indexers like Lucene are used to index the logs for better search performance and then the output is stored in Elasticsearch or other output destination. The data in output storage is available for Kibana and other visualization software.

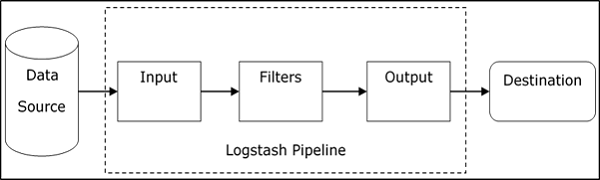
Logstash Internal Architecture
The Logstash pipeline consists of three components Input, Filters and Output. The input part is responsible to specify and access the input data source such as the log folder of the Apache Tomcat Server.
Common Syntax
The Logstash configuration file just copies the data from the inlog.log file using the input plugin and flushes the log data to outlog.log file using the output plugin.
Syntax:
file {
path => "C:/tpwork/logstash/bin/log/inlog.log"
}
}
output {
file {
path => "C:/tpwork/logstash/bin/log/outlog.log"
}
}
Cmd Run Logstash
Logstash uses –f option to specify the config file.

Problem Statement:
There was a need to synchronize various tables in Elasticsearch to enable search functionality. However, each time a new index had to be created, it required writing custom code, which was time-consuming and often tedious.
Solution:
Thanks to Logstash, this process can now be accomplished quickly and easily. Logstash allows us to sync multiple tables effortlessly through its pipeline configuration.
EXPLAINING SAMPLE CONFIG
Now let’s break down the provided Logstash configuration:
jdbc {
jdbc_driver_library => "\path\mysql-connector-j-8.1.0\mysql-connector-j-8.1.0.jar"
jdbc_driver_class => "com.mysql.cj.jdbc.Driver"
jdbc_connection_string => "jdbc:mysql://localhost:3306/database"
jdbc_user => "root"
jdbc_password => "root"
schedule => "*/2 * * * *"
statement => "SELECT * FROM table_name
WHERE id > :sql_last_value limit 100; "
use_column_value => true
tracking_column => "id"
tracking_column_type => "numeric"
last_run_metadata_path => "\path\z_index_one.txt"
tags => ["table_name"]
jdbc_default_timezone => "UTC"
}
}
output {
if "table_name" in [tags] {
elasticsearch {
hosts => ["http://localhost:9200/"]
index => "index_name"
document_id => "%{id}"
}
}
}
Output:
Specifies the input source for Logstash. In this case, it’s using the jdbc input plugin, which allows Logstash to query a JDBC database.
- jdbc_driver_library: Path to the JDBC driver library.
- jdbc_driver_class: JDBC driver class name.
- jdbc_connection_string: JDBC connection string to the database.
- jdbc_user: Username for database authentication.
- jdbc_password: Password for database authentication.
- schedule: Cron expression defining how often the SQL query should be executed.
- statement: SQL query to execute. :sql_last_value is a Logstash parameter used for incremental fetching.
- use_column_value: Specifies whether to use the last value of the tracking column.
- tracking_column: Column used for tracking incremental changes.
- tracking_column_type: Data type of the tracking column.
- last_run_metadata_path: Path to the file where Logstash stores metadata about the last execution.
- tags: Additional metadata attached to events generated by this input.
Output: Specifies the destination for processed data. In this case, it’s using the Elasticsearch output plugin to send data to Elasticsearch.
- if: Conditional statement to filter events based on their tags.
- elasticsearch: Specifies Elasticsearch as the destination.
- hosts: Elasticsearch cluster URLs.
- index: Index name where data will be stored.
- document_id: Document ID to use when storing data. Here, it’s using the id field from the incoming data.